The EURUSD pair has been a popular choice for many forex traders due to its high liquidity and volatility.
Technical analysis is a crucial tool for analyzing the EURUSD pair’s movements and making informed trading decisions.
In this analysis, we will take a deep dive into the current EURUSD technical analysis, analyzing the daily, 4-hour, and 1-hour charts.
| Key Takeaways |
|---|
| EURUSD bullish momentum on the daily chart is still strong, despite rejection at various supply zones. |
| The price action is still above the 50-SMA and 200-SMA, which is regarded as a bull trend by many technical chartists. |
| The 50 simple moving average could provide the needed support to continue the bull trend if we see a pullback of price action. |
| The EURUSD currency pair is showing clear signs of weakness on the 4-hour and 1-hour charts. |
| The high impact news for the US Dollar could influence the pair. |
| Traders should pay attention to the FOMC Meeting Minutes, CPI, PPI, and retail sales data. |
| Traders should look out for a potential pullback to the earlier anticipated demand zone, which could act as a support level. |
| Targets for the EURUSD pair are at 1.03989 and 1.01158, respectively. |
Daily Chart Analysis: Is the Bullish Momentum Still Strong?
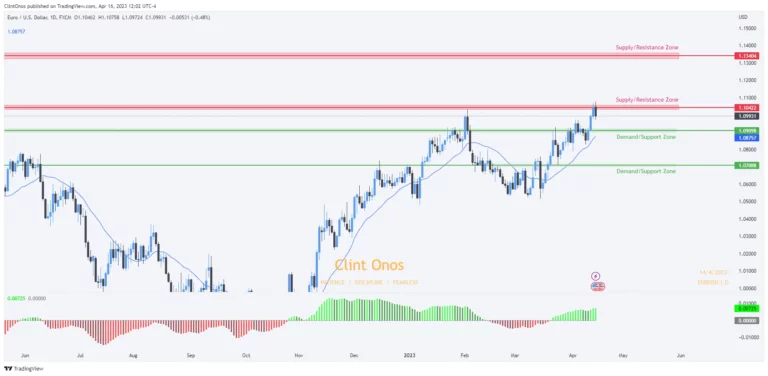
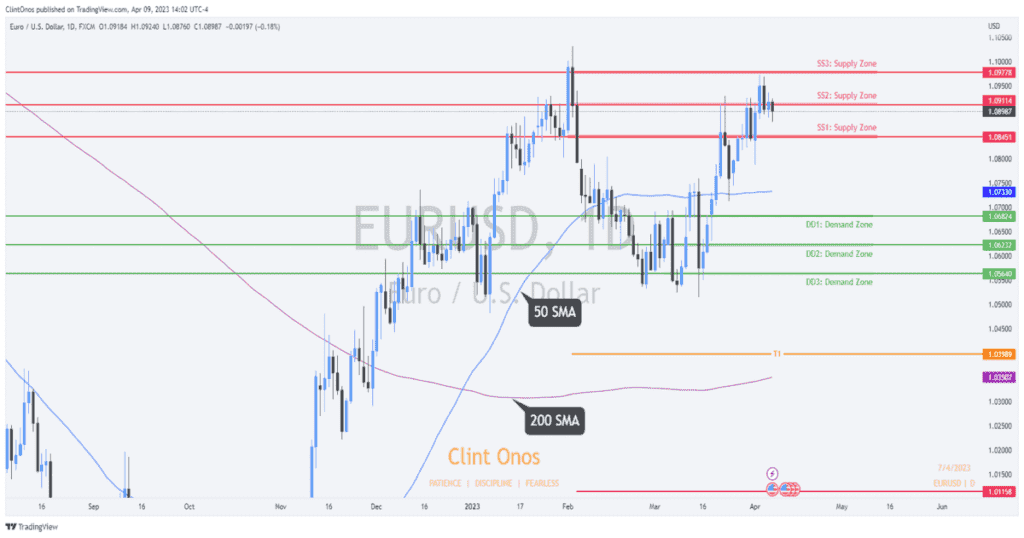
The EURUSD bullish momentum on the daily chart seems strong, despite the rejection seen at various supply zones, namely 1.08451, 1.09114, and 1.09778.
In our last week’s EURUSD technical analysis, we made a projection for a pull-back of the current bull-controlled market based on Friday 31st March’s daily candle bearish close.
The bear control was short-lived as price action traded to our 3rd labeled supply zone.
Going into the new week, the EURUSD pair shows a bearish reversal signal, with a down candle close below the 2nd supply zone.
With the 1st supply zone already invalidated and likely to act as resistance, the big question now is, can the price pull back to the earlier anticipated demand zone 1?
Only data in the coming week can answer that question accurately.
It is important to note that the price action is still above the 50-SMA and 200-SMA, which is regarded as a bull trend by many technical chartists.
If we see a pull-back of price action, there is a high possibility that the 50 simple moving average will provide the needed support to continue the bull trend.
Our expectation is still to the downside, with 1.03989 as target 1 and 1.01158 as target 2, which is around the 200-SMA, as seen on the daily chart.
4-hour Chart Analysis: Clear Signs of Weakness
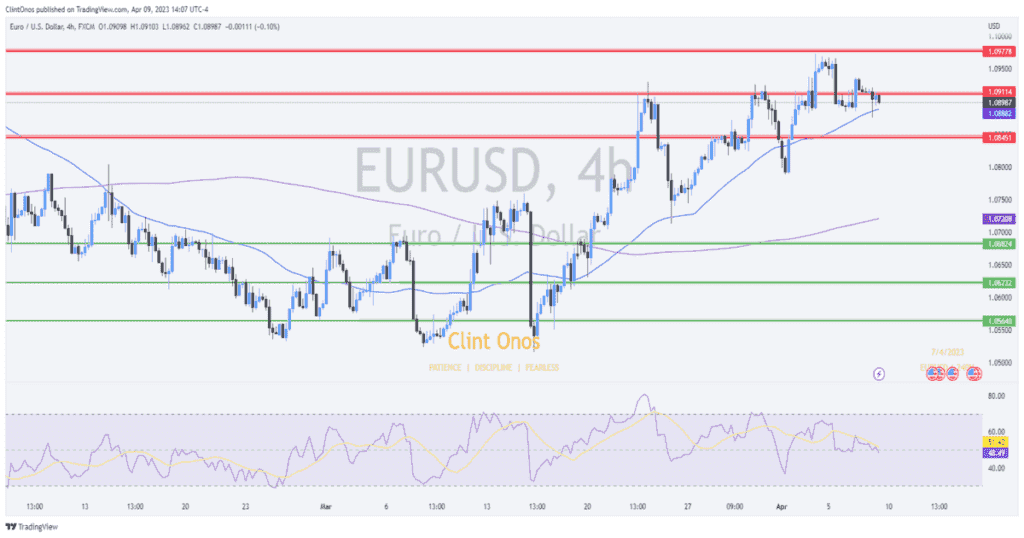
On the 4-hour chart, the EURUSD currency pair is showing clear signs of weakness.
This is very obvious, looking at the divergence seen with the Relative Strength Index (RSI). The RSI is currently at the 50 level, with several attempts to break below.
The 50-SMA is acting as support as of the last trading hour. Can this support be trusted? If the price breaks the support, there is a high possibility of reaching the first demand zone at 1.06824.
1-hour Chart Analysis: Shift in Bias or Momentum
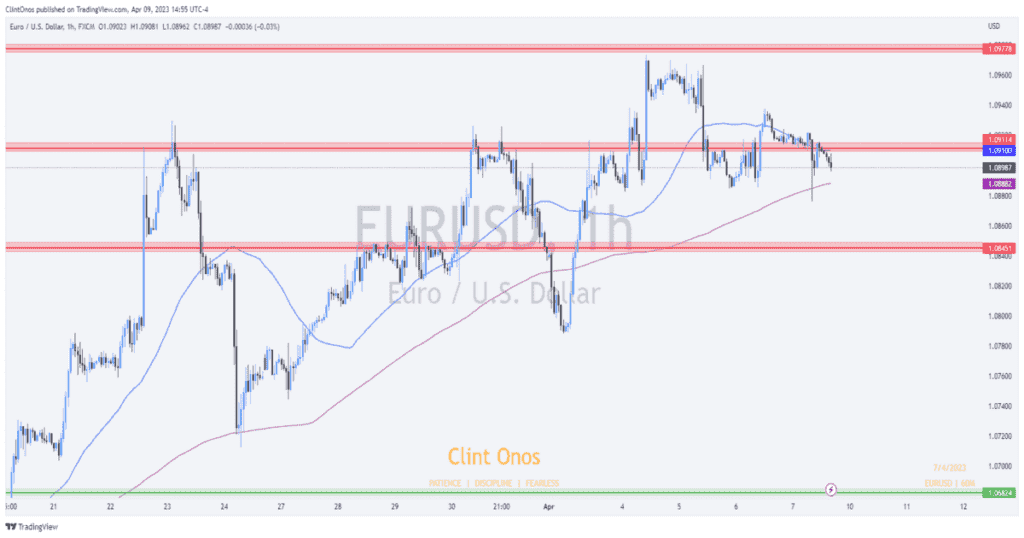
The story is not different on the 1-hour chart, as we can clearly see the price showing the bull pressure fading gradually.
The price is already trading below the 50-SMA, which is a sign of a shift in bias or momentum, as the case may be.
If the price closes below the 200-SMA and stays below on the 1-hour chart, then we can be confident that the price will trade back to the first invalidated supply zone if it fails to support the price.
High Impact News to Take Note of
There is not much high-impact news that can influence the pair as far as EURO is concerned.
However, there is high-impact news for the US Dollar, according to data on the Forex factory calendar.
Below are some of the news to take note of:
- Tue Apr 11, 11:00 pm – FOMC Member Harker Speaks
- Wed Apr 12, 1:30 pm – CPI m/m
- Wed Apr 12, 2:00 pm – 10-y Bond Auction
- Wed Apr 12, 7:00 pm – FOMC Meeting Minutes
- Wed Apr 12, 8:15 pm – BO
Conclusion: What to Expect Next!
Technical analysis is an essential tool for forex traders, providing them with a disciplined and objective approach to trading.
The EURUSD technical analysis suggests a strong bullish momentum on the daily chart, with potential pull-backs to the anticipated demand zone 1.
However, the 4-hour and 1-hour charts indicate a possible shift in momentum, with clear signs of weakness and potential bearish pressure.
Traders should implement risk management strategies, such as stop-loss orders, wise leverage use, and portfolio diversification, to minimize losses and protect their capital.
Staying updated on market news and developments is also crucial to make informed trading decisions and navigate the forex market successfully.
By using these tools and strategies, traders can potentially profit from the EURUSD pair’s movements while minimizing risks.

